Scan
Every hour during market hours (and after close), Oversold Radar scans around 200 US stocks across 11 sectors and computes each candidate's Radar Score from 11 checks (plus any Congressional bonus).
Too many numbers to track on your own. Oversold Radar checks them for you every hour.
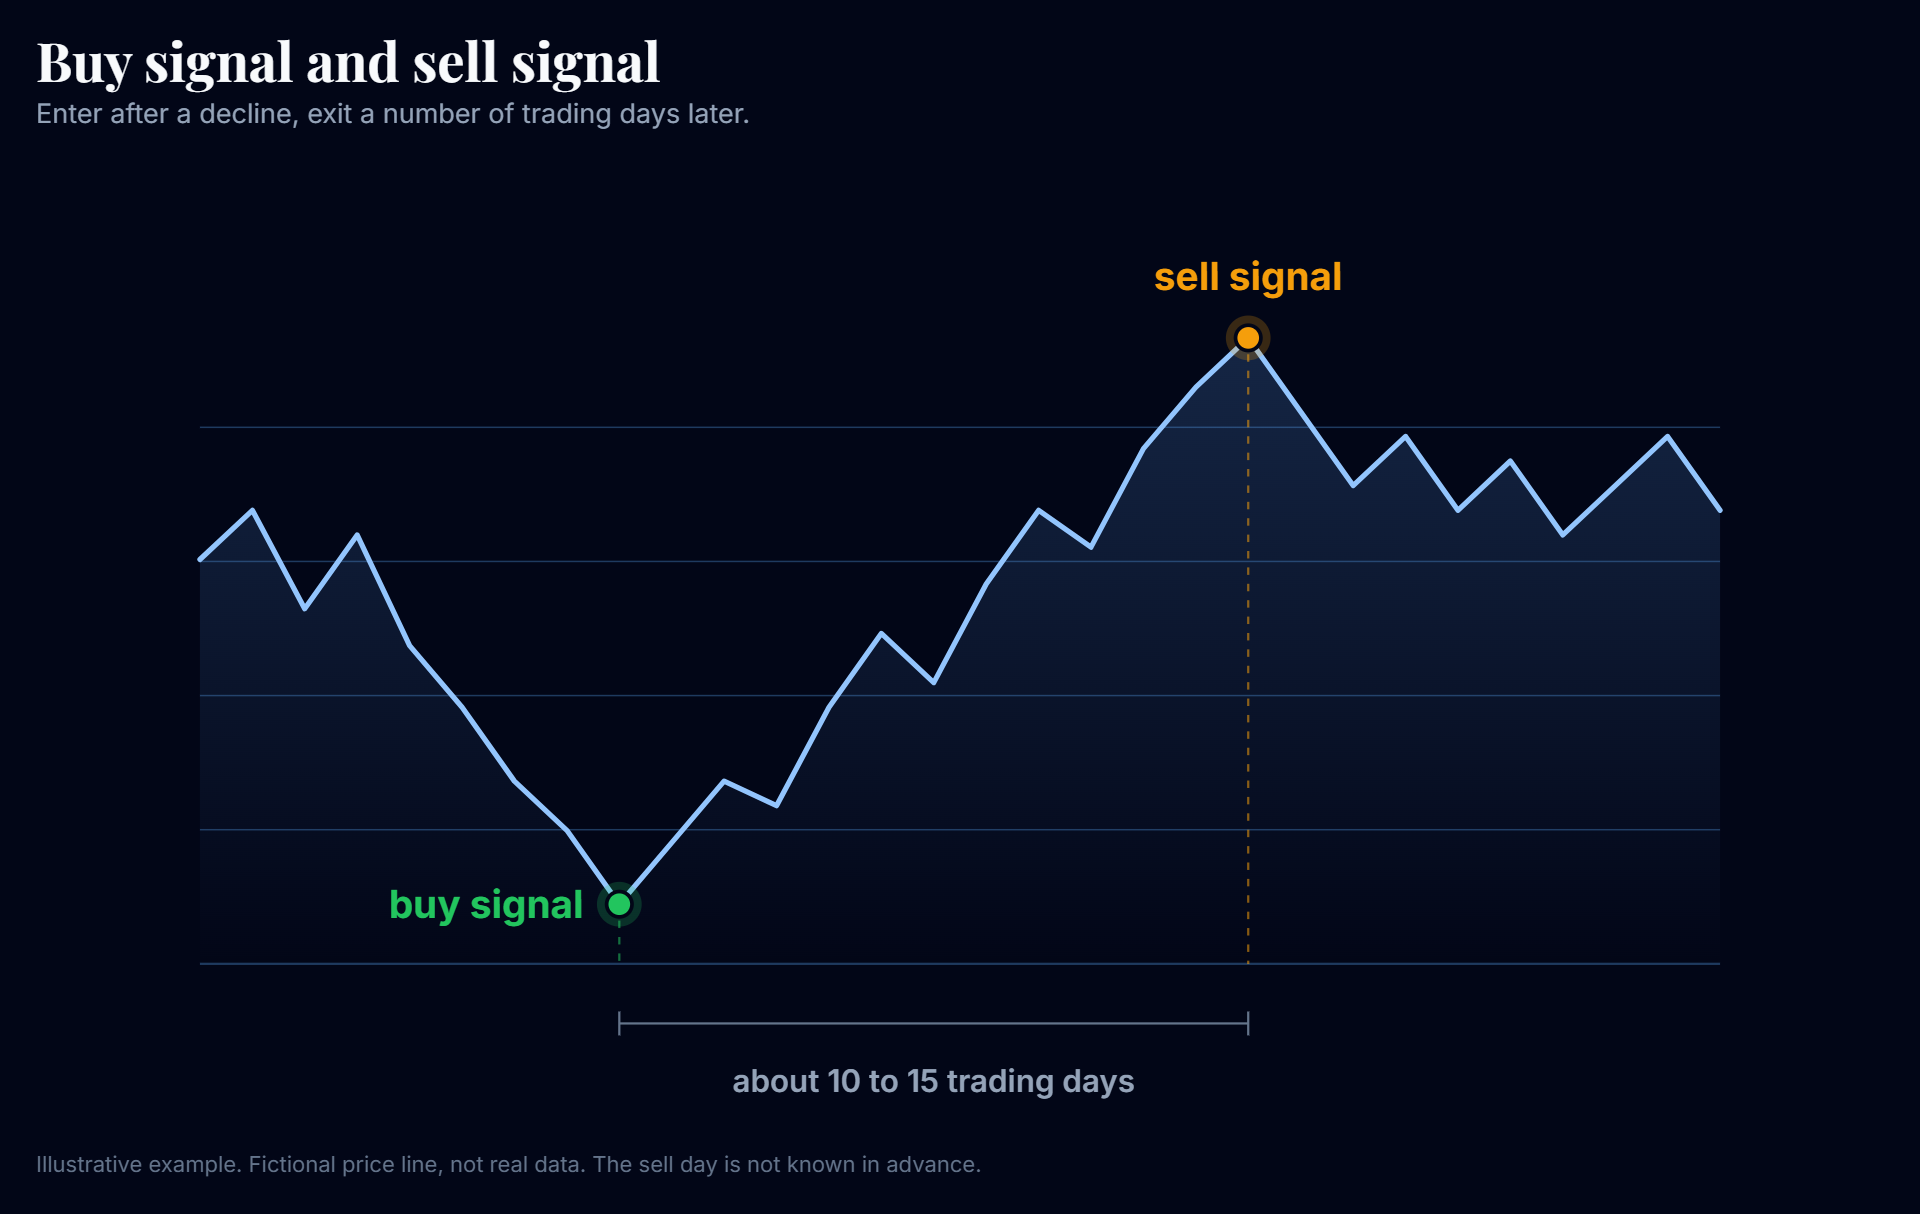
When public market data align favorably, you receive one clear buy signal. The sell signal follows several trading days later.
Every hour, we check around 200 listed US stocks on eleven different points, from price movement and valuation to average analyst expectations. If a stock clears the threshold, it gets a stricter final review. You receive the same general signal only when I buy first with my own money. You decide for yourself and trade with your own broker.
Illustration of the fixed check routine. Not advice, no automatic execution, no performance promise.
Oversold Radar tells you when to enter, which stock, and when to exit. You place the order at your own broker, such as DEGIRO, IBKR, Saxo or another. No lock-in, no account linking.
THE PROCESS
Scan, final check, validated signal, email, then your own order at your broker.
Every hour during market hours (and after close), Oversold Radar scans around 200 US stocks across 11 sectors and computes each candidate's Radar Score from 11 checks (plus any Congressional bonus).
clearing the bar triggers a stricter final check; most candidates drop out. Silence beats a weak trade.
only when the setup passes validation and I make the trade myself does a signal appear. No trade, no signal.
You receive the buy or sell signal by email, with the Radar Score and the entry zone included. You do not know in advance on which day you will exit again, and you do not need to: that is what the sell signal is for. You do not need to act on a signal to the hour; there is no rush. Carry it out on the same trading day or the next trading day. The entry zone and the reasoning are in the signal, so you can place your own order calmly.
you place the order yourself at your own broker, such as DEGIRO, IBKR or Saxo. No linking, no lock-in.
Oversold Radar never executes anything automatically. You decide and trade yourself.
The Radar Score
Every signal rests on a Radar Score that runs eleven checks at once, from price data and trend to valuation and analyst consensus. Each check is one point; together they gauge whether a fallen stock is ready to recover. The score runs from 0 to 12: eleven checks plus any Congressional bonus.
RSI, MACD and Bollinger Bands gauge whether the stock has fallen too far and whether momentum is starting to turn.
a volume spike at an oversold RSI shows buyers returning, not a fizzled-out dip.
EUR 0
Start free, no card needed
Start freeEUR 14.99/mo
or EUR 149 per year
Go ProEverything in Free, plus:
Multiple data sources, every hour, across the whole selection. We set it up and keep it running, so you do not have to. See all data sources
You decide and trade at your own broker. General information, not personal advice.
You decide how much you invest. You do not need a large amount to start; you begin with what feels comfortable for you.
Worked example, not an expectation. Suppose you invest EUR 1,500 and reinvest the full amount after the first gain. Two consecutive profitable rounds (each a buy plus a sell) at 6% produce a combined gain of about EUR 185. At 8% per round, that is about EUR 250, mathematically more than the EUR 149 annual subscription.
The 6 to 8% range is the current average of profitable rounds only in our still limited track record. It says nothing about how often a gain occurs. A round can also result in a loss. In that case, you may not earn back the subscription cost.
Risk: prices can fall. You can lose part of your investment. Past results do not guarantee future results. Transaction costs, currency costs and taxes are not included.
Track record
The track record is still small (fewer than 30 closed trades); returns are indicative and no guarantee of future results.
view all resultsPublic track record
On average +4.27% per round in about 9 trading days. 5 of 7 closed rounds were profitable.
| Ticker | Bought | Sold | Trading days | Return | Outcome |
|---|---|---|---|---|---|
| SBUX | Jun 1, 2026 | Jul 7, 2026 | 26 | +6.43% | Win |
| BKR | Jun 29, 2026 | Jul 6, 2026 | 5 | -7.36% | Loss |
| DE | May 26, 2026 | Jun 2, 2026 | 5 | +7.72% | Win |
| FCX | May 4, 2026 | May 7, 2026 | 3 | +8.64% | Win |
| JNJ | Apr 22, 2026 | May 5, 2026 | 9 | -2.63% | Loss |
| DVN | Apr 16, 2026 | Apr 30, 2026 | 10 | +10.42% | Win |
| SOFI | Apr 7, 2026 | Apr 14, 2026 | 5 | +6.68% | Win |
Illustrative example, not a prediction
The honest starting point is +13.4% over roughly three months (April to July 2026). What that would mean for a full year depends entirely on assumptions and is NOT a prediction.
| Scenario | Assumption | Indicative per year |
|---|---|---|
| Same pace, linear | +13.4% per quarter, 4 quarters side by side | about +53% |
| Same pace, compounded | +13.4% per quarter, profit reinvested | about +65% |
| Half pace | +6.7% per quarter | about +30% |
support@oversoldradar.com
Send your message; happy to help before you go Pro.